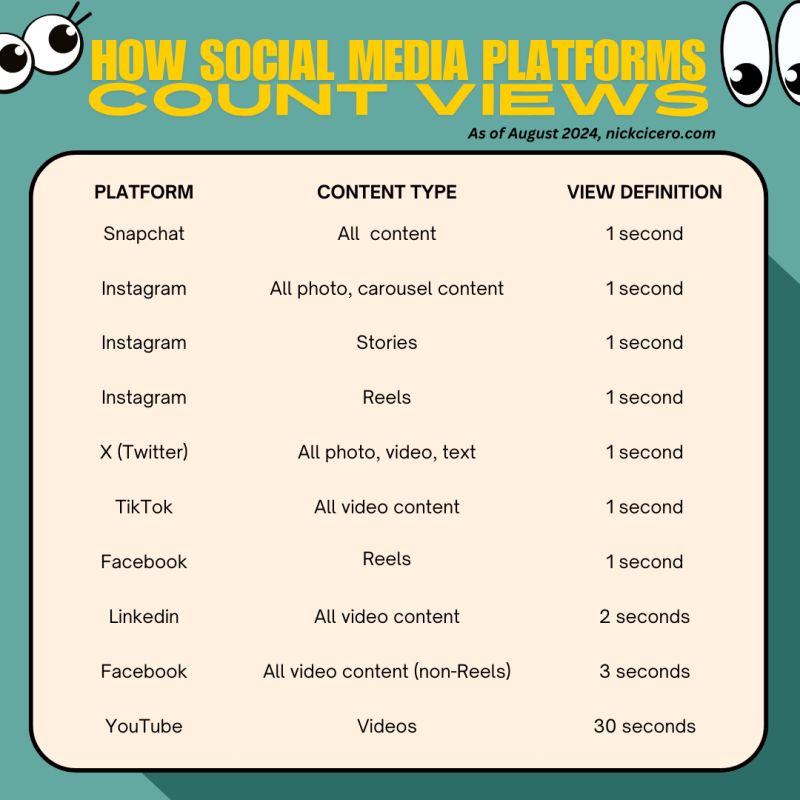
How Social Media Platforms Count Views
👀 What’s in a View? 👀
It feels like Groundhog Day all over again – Instagram is getting rid of the impressions metric, the plays metric, and replacing them with the “view” for all content types—Reels, photos, carousels, Stories, and more.
But this isn’t the 3-second view from a few years ago. Instead, Instagram joins the trend of consolidating metrics around the 1-second view (basically an impression or the millisecond the content hits the screen).

First it was Snapchat, then TikTok followed with the 1-second view count. Instagram rolled out Plays with the launch of Reels, also at 1 second. Then Twitter changed their platform so every piece of content had a view count.
When IG introduced Reels everywhere all videos became classified as Reels, then carousels expanded to include photos and videos together – now engagement could now be measured not just by views but by interactions with multiple pieces of mixed content within a single post.
Social Video 1.0 gave us conflicting metrics across platforms, creating complexity. A unified one-second view simplifies analytics and provides a clear, consistent measure across platforms—though there is a double-edged sword of simplification
Simplicity and Comparability: The 1-second view metric provides a straightforward way to measure and compare content performance, making it easier for creators and marketers to optimize strategies across Instagram, TikTok, and X.
Superficial Engagement: A 1-second view might capture initial interest but doesn’t reflect deeper engagement.
–
With over 50% of Instagram feed content now being recommended by AI, understanding engagement metrics becomes even more critical. The shift from a social graph, to an interest graph, where AI curates content based on user preferences, means it’s critical to understand what other types of content and themes are performing well across lots of different accounts, not just how your own content performs in a bubble. Almost like a formula to success in this new space:
{Success} = {Contextual Relevance} + {Depth of Engagement}
1. Contextual Relevance (Public Benchmarks)
Understanding What’s Trending: What’s being served by the algorithm? What’s driving high view counts this week? How do we adapt to changing themes, interests + content styles to understand what’s driving attention.
Benchmarking Performance: Regularly compare your content’s performance against industry benchmarks to stay competitive and relevant.
Responsive Content Creation: Use real-time data to adjust your content strategy on the fly.
2. Depth of Engagement (Owned Analytics) – Beyond the 1-Second View deeper metrics like watch time, shares, and comments are crucial for understanding true engagement.
–
Here’s a simple chart outlining aggregating a view in concept of time – looking forward to hearing all the reactions from the industry to this change. Thanks Lia Haberman for flagging & Andrew Hutchinson for early coverage


